Control center
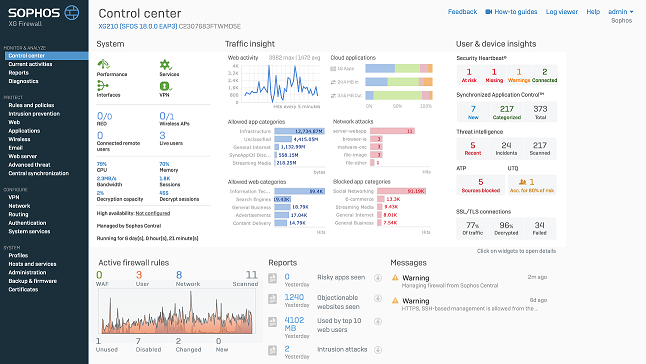
The Control center shows the features in use and the health and security of the network.
The Control center is the first page you see whenever you sign in to Sophos Firewall. The page is arranged into six areas that provide an overview of the features being used and the health and security of your system.
You don't make any configuration changes on this page. For details about the information shown here, continue on this page. Otherwise, to continue setting up Sophos Firewall, see Interfaces.
System widget
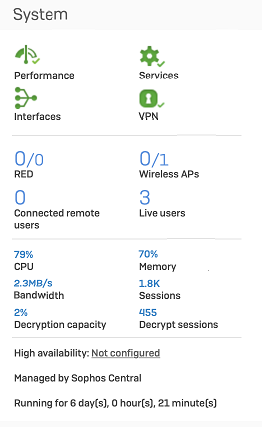
The system panel is broken down into four areas to give you a quick overview of various system parameters. The first area has four icons representing the following:
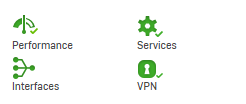
- Performance: Shows the overall performance of Sophos Firewall in terms of resource usage, such as CPU and RAM.
- Services: Shows if all services are running as expected.
- Interfaces: Shows if there are any issues with the configured network interfaces.
- VPN: Shows the status of connected VPN tunnels.
Clicking an icon shows further information about that specific area of the system in the following way:
- Performance: Shows a load average graph. Load average is the average number of processes waiting to run on a CPU. Any number greater than the number of processor cores in the system indicates that, during the period being measured (for example, 5 minutes), there was more work to do than the system was capable of doing.
- Services: Clicking the icon shows the services that are stopped or dead.
- Interfaces: Shows details of the configured interfaces, such as status, bits received, and bits transmitted.
- VPN: Shows the details of connected VPN tunnels.
The second area of the panel gives details of connected RED devices, Wireless APs, Connected remote users, and total Live users.
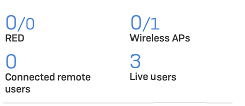
RED
Shows the number of RED tunnels established, followed by the total number configured. For example, 1/4. Clicking the widget shows a list of RED tunnels.
Wireless APs
Shows the number of active access points, followed by the total number of access points configured. For example, 2/3. Pending access points, if any, are shown separately in a bracket in red color. Clicking the widget redirects to the Access points page.
Connected remote users
Shows the total number of users connected remotely through SSL VPN. Clicking the widget redirects to the Remote users page.
Live users
Shows the total number of live users. Clicking the widget redirects to the Live users page.
The third area of the panel gives details of the system resources currently being used by Sophos Firewall. These are as follows:
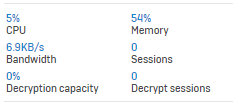
CPU
Shows the current CPU load as a percentage.
Memory
Shows the current usage of the system RAM in percentage.
Bandwidth
Shows the current bandwidth of traffic passing through Sophos Firewall.
Sessions
Shows the current sessions for users connected to Sophos Firewall.
Decryption capacity
Shows the decrypted SSL/TLS connections of your firewall's decryption capacity in percentage.
Decrypt sessions
Shows the current number of decrypted SSL/TLS connections.
Decryption details are updated every five minutes.
The final area of the panel shows if the system has been configured for high availability or has been connected to Sophos Firewall Manager for central management. You can also see how long the system has been running since the last restart.
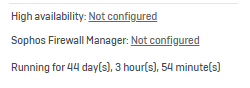
If you've configured high availability, the status is shown as follows:
High availability (HA)
A-A  : Active-active mode.
A-P (M)  : Active-passive mode. Acting as primary device.
A-P (S) : Active-passive mode. Acting as auxiliary device.
Traffic insight widget
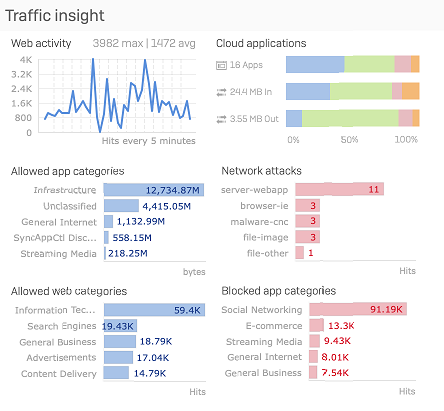
This section provides statistics on network traffic processed by Sophos Firewall in the last 24 hours. It helps you see who uses most bandwidth, which websites and applications are most used, and where there are unusual traffic patterns.
The following statistics are available:
- Web activity: The graph shows how much data users transferred over the last 24 hours, which helps understand the web surfing trend. It also shows the maximum and average amount of data transferred, in bytes, over the last 24 hours, which helps you spot unusual traffic patterns.
- Cloud applications: This graph shows the number of cloud applications users connect to. It also shows traffic, in bytes, that is sent to and from these applications by your network.
- Allowed app categories: The graph shows the amount of data transferred, in bytes, for the top five application categories. This shows the most-used applications in the last 24 hours, which helps you identify which applications consume the most bandwidth. Clicking the bar of a specific application category in the graph redirects you to the filtered application report of that category.
- Network attacks: The graph lists the top five hosts that were denied access to the network due to health reasons. Clicking the bar of a specific attack category in the graph redirects you to the filtered report of that category.
- Allowed web categories: The graph shows the amount of data transferred, in bytes, for the top five web categories. This shows the most-visited websites in the last 24 hours, which helps you identify which websites consume the most bandwidth. Clicking the bar of a specific web category in the graph redirects you to the filtered report of that category.
- Blocked app categories: The graph shows the top five denied application categories and the number of hits per category. This helps you find out the applications with the most failed access attempts. Clicking the bar of a specific application category in the graph redirects you to the filtered application report of that category.
User and device insights
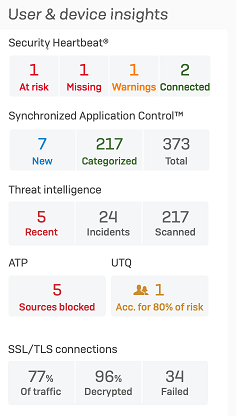
The User & device insights panel shows details of user and device activity on your network and helps you identify devices at risk.
- Security Heartbeat: Shows the total number of connected endpoints with Security Heartbeat turned on and the number of these that are at risk, have a missing Heartbeat, or have produced a warning. Clicking the relevant box shows more details about the endpoints to enable you to quickly find the affected devices.
- Synchronized Application Control
- Threat intelligence
- ATP
- SSL/TLS connections
Active firewall rules
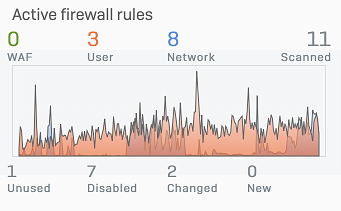
Shows the number of firewall rules by rule type and rule status. It shows the traffic, in bytes, that matched the firewall rules in the past 24 hours.
- To see the data volume, hover over the chart.
- To see the rules in the Firewall rule table, select a firewall rule status. The rule table sets a filter based on your selection.
All administrators, irrespective of their rights, can see the firewall rules.
Note
A rule might be in more than one status list for a short time. That's because it stays on a list for a certain time, even if its status changes. See the following example:
Rule name: Test
Rule creation: 10 AM. Test rule is listed under New until 10 AM the next day.
Rule change: 11 AM. Test rule is listed under Changed until 11 AM the next day.
Usage check: If Sophos Firewall performs a usage check at noon and the Test rule remains unused, the rule is listed under Unused until the next usage check.
Turned off: 01 PM. Test rule is listed under Disabled. A disabled rule is listed under Changed and Disabled.
Reports
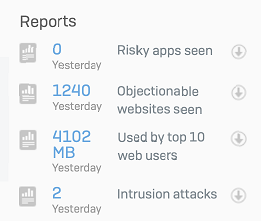
Depending on the modules subscribed, at most, five critical reports from the table below are shown:
| Report name | Number/data shown | Subscription module |
|---|---|---|
| High risk applications | <number of> risky apps seen yesterday | Web Protection |
| Objectionable websites | <number of> objectionable websites seen yesterday | Web Protection |
| Web users | <data transfer> (in bytes) used by top 10 users yesterday | Web Protection |
| Intrusion attacks | <number of> intrusion attacks yesterday | Network Protection |
| Web server protection | <number of> web server attacks yesterday | Web Server Protection |
| Email usage | <data transfer> (in bytes) used | Email Protection |
| Email protection | <number of> spam mails yesterday | Email Protection |
| Traffic dashboard | - | Either Web Protection or Network Protection |
| Security dashboard | - | Either Web Protection or Network Protection |
Messages panel
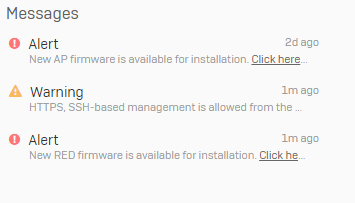
The panel shows information that allows you to monitor and track system events.
Examples of alerts include:
- The default password for the “admin” user has not been changed. We highly recommend you to change the password. This alert is shown when the default password for the super administrator isn’t changed.
- New firmware available for Sophos Firewall or connected devices such as APs or RED devices.
- The default web admin console password has not been changed.
- HTTPS or SSH based management is allowed from the WAN. This is not a secure configuration. We recommend using a good password.
- Your Sophos Firewall is not registered.
- The modules expired.
Icons are used for easier identification of messages.
 : Indicates alert messages.
 : Indicates warnings.
 : Indicates firmware download notifications.