Threat Graph analysis
You can investigate a threat graph by going to its details page and using the analysis tools there.
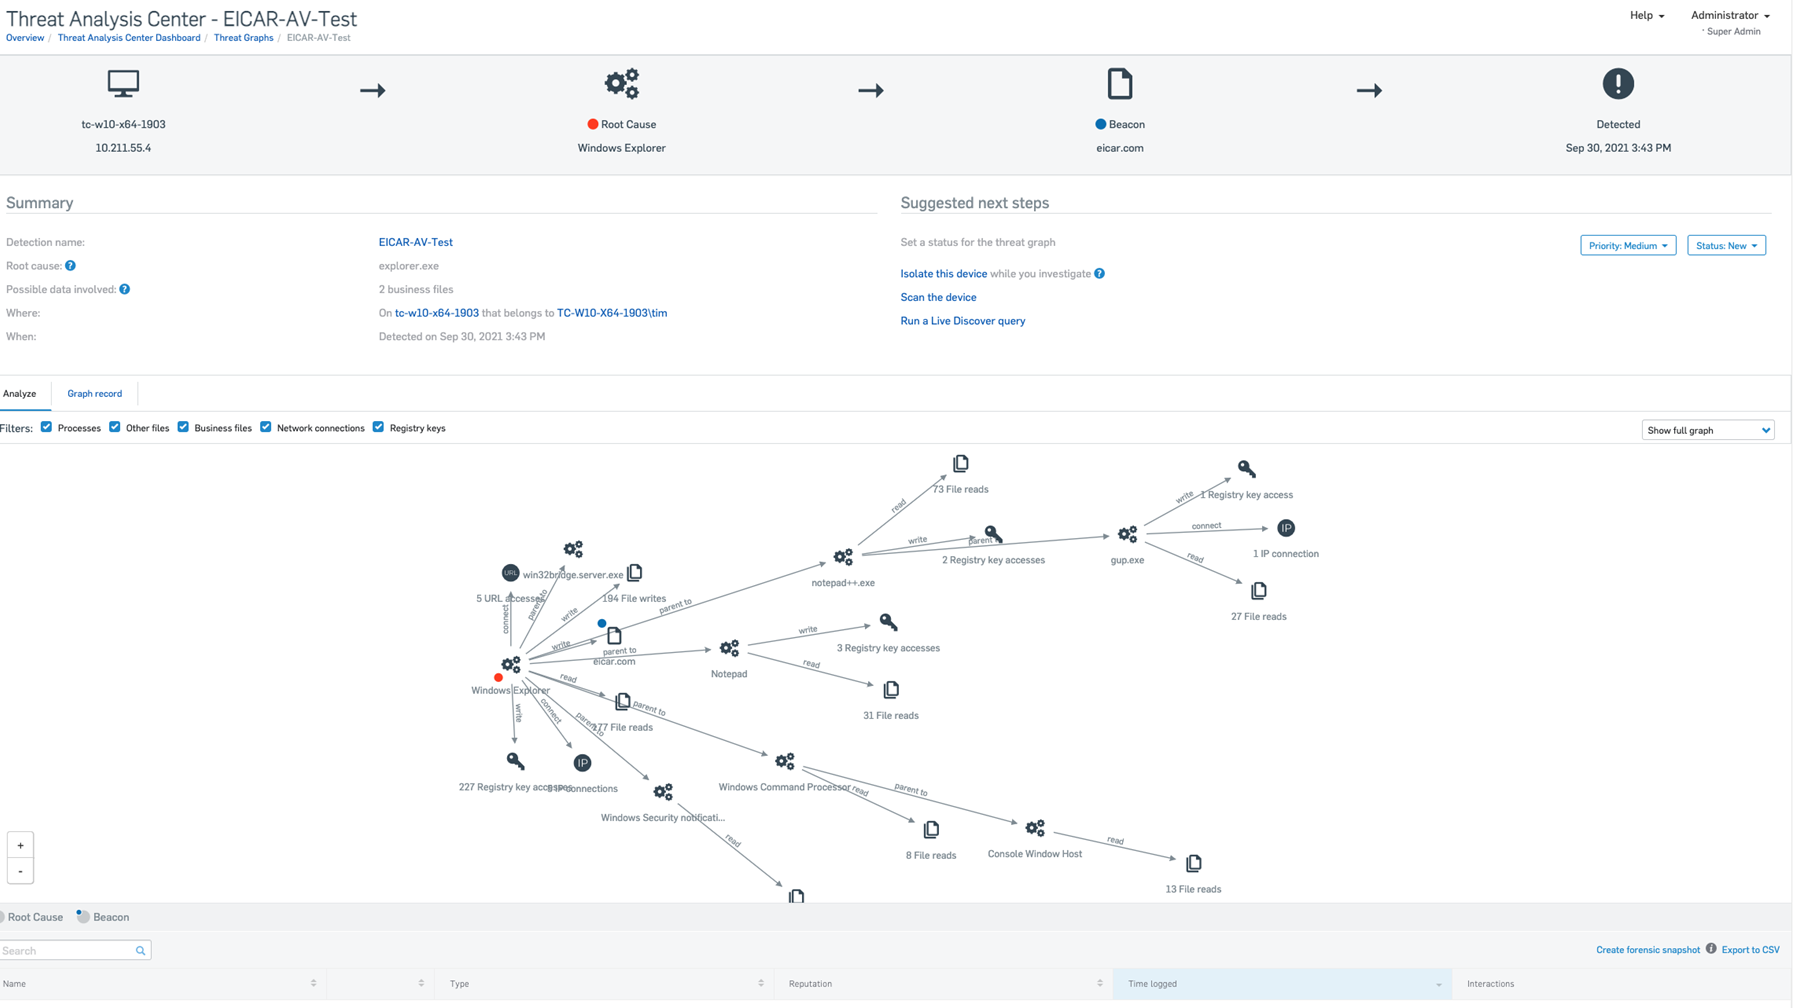
Find the threat graph on the Threat Graphs page. Click its name to see a simplified event chain, summary, details of the artifacts (processes, files, keys) affected, and a diagram showing how the threat developed. The following screenshot shows an Eicar-AV-Test detection triggered by opening a file eicar.com in Windows Explorer.
For an overview of what to do, see “How to investigate and clean up threats” in Threat Graphs.
For more details of all the options, read the sections on this page.
Note
The options you see may depend on your license and on the severity of the threat.
For more information about using threat graphs to investigate detections see Threat Graphs examples: Malware detections.
Summary
The Summary shows you a summary of the threat, including these details:
- Root cause: Where the infection entered your system.
- Possible data involved: Files that might contain important data. Check them to see if data has been encrypted or stolen.
- Where: Name of the device and its user.
- When: Detection time and date.
Suggested next steps
The Suggested next steps pane shows you the following:
Priority: A priority is set automatically. You can change it.
Status: The status is New by default. You can change it.
Note
After you set the status to In progress you cannot reset it to New.
Isolate this device: You see this if the graph is high priority and if you have Intercept X Advanced with XDR or Intercept X Advanced for Server with XDR. It enables you to isolate the device while you investigate potential threats.
You can still manage the device from Sophos Central. You can also still submit files from the isolated device to Sophos for analysis.
You can also allow isolated devices to communicate with other devices in limited circumstances. For more information, see Device isolation exclusions.
You can remove the device from isolation at any time. You'll see a Remove from isolation option under Suggested next steps.
Note
You don't see Isolate this device if the device has already isolated itself automatically. See “Device Isolation” in Threat Protection Policy.
Scan the device: You can use this link to scan the affected device for threats.
Analyze
The Analyze tab shows the chain of events in the malware infection.
A menu on the right of the tab lets you choose how much detail you see:
- Show direct path: This shows the chain of directly-involved items between the root cause and the item where the infection was detected (the "beacon").
- Show full graph: This shows the root cause, beacon, affected artifacts (applications, files, keys), the path of the infection (shown by arrows), and how the infection occurred. This is the default setting.
To display or hide the different types of artifact, use the checkboxes above the diagram.
To see details of an item, click it. This opens a details pane on the right of the diagram.
Graph record
The Graph record tab shows the history of the threat graph, from its creation by Sophos or the admin. You can post comments to record actions that have been taken and other relevant information.
Process details
When you click an affected item, you see the Process details pane. If someone has already submitted the file to Sophos, you see the latest threat intelligence.
If the file hasn't been submitted, or you want to see if there's any updated intelligence, click Request latest intelligence.
This shows the latest information about the file's global reputation and whether you need to investigate.
Artifacts list
This is a list below the diagram of the malware attack. It shows all the affected items, for example business files, processes, registry keys, or IP addresses.
You can export a comma separated (CSV) file containing a list of the affected artifacts, by clicking on Export to CSV at the top right of the tab.
The list shows:
- Name: Click the name to see more information in a details pane.
- Type: The type of artifact, such as a business file or a registry key.
- Reputation
- Time logged: The time and date a process was accessed.
- Interactions
Create forensic snapshot
You can create a "forensic snapshot" of data from the device. This gets data from a Sophos log of the device's activity and saves it on that device. For more information on forensic snapshots see Forensic snapshots.
You can also save it in the Amazon Web Services (AWS) S3 bucket you specify. You can then do your analysis.
You'll need a converter (which we provide) to read the data.
Note
You can choose how much data you want in snapshots and where to upload them. To do this, go to Global Settings > Forensic Snapshots. These options may not be available for all customers yet.
To create a snapshot, do as follows:
-
Go to a threat graph's Analyze tab.
Alternatively, on the details page of the device, open the Status tab.
-
Click Create forensic snapshot.
- Follow the steps in Upload a forensic snapshot to an AWS S3 bucket.
You can find the snapshots you generated in %PROGRAMDATA%\Sophos\Endpoint Defense\Data\Forensic Snapshots\.
Snapshots generated from detections are in %PROGRAMDATA%\Sophos\Endpoint Defense\Data\Saved Data\.
Restriction
You need to be an administrator with access to the tamper protection password and run a command prompt as an administrator to access the saved snapshots.