NDR dashboard
This beta feature might not be available to all customers.
The NDR dashboard shows activity by Sophos Network Detection and Response (NDR), which detects malicious behavior on your network.
If you haven't set up NDR yet, see Sophos NDR on ESXi or Hyper-V or Sophos NDR on AWS.
View the dashboard
To view the NDR dashboard, do as follows:
Go to Threat Analysis Center > NDR dashboard.
The NDR dashboard shows activity data in visual form.
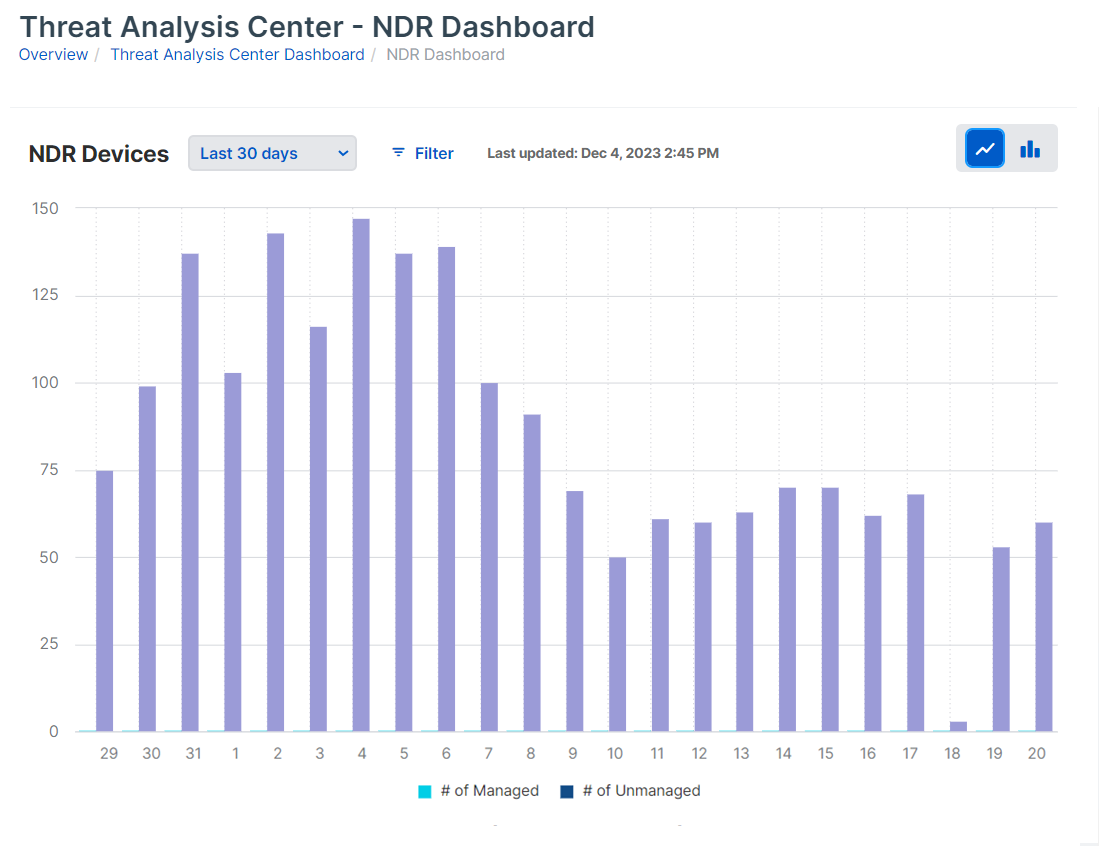
The charts available are as follows:
- NDR Devices. Shows the number of managed and unmanaged devices.
- NDR Protocols. Shows the data downloaded or uploaded in MB.
- NDR Flow Detections. Shows the number of detections of malicious behavior.
There's also a world map showing the location of the detections.
Time range
You can select the time range that the charts show.
In the drop-down, you can select the last hour, 24 hours, 7 days, or 30 days. The default is 30 days.
To set a custom time range, select Custom and select dates from the calendar.
Change the chart type
You can view each report as a bar chart or a line graph.
To change the chart type, go to the upper right of the page and click the icon for the type you want.
![]()
Filters
You can filter the results in charts by the device details, as follows:
- Click Filter.
-
Enter the MAC Address, IP Address, or Hostname and click Apply.
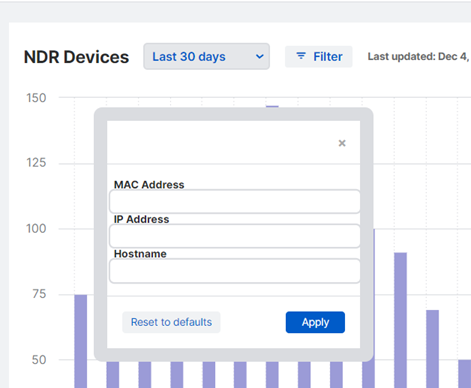
To clear the filters, click Reset to defaults.