Detections
Detections show you activity that you might need to investigate.
Detections identify activity on your devices that's unusual or suspicious but hasn't been blocked. They're different from events where we detect and block activity that we already know to be malicious.
We generate detections based on data that devices upload to the Sophos Data Lake. We check that data against threat classification rules. When there's a match, we show a detection.
This page tells you how to use detections to look for potential threats.
Note
Cases can automatically group related detections together for more advanced analysis. See Cases.
Set up detections
If you don't have detections yet, you need to allow devices to upload data to the Sophos Data Lake so that we can use it.
You can upload data from Sophos products and from third-party products.
For uploads from Sophos products, see Data Lake uploads. For uploads from third-party products, see Integrations.
See your detections
To see your detections, go to Threat Analysis Center > Detections.
The Detections page shows detections data as a bar chart and as a list.
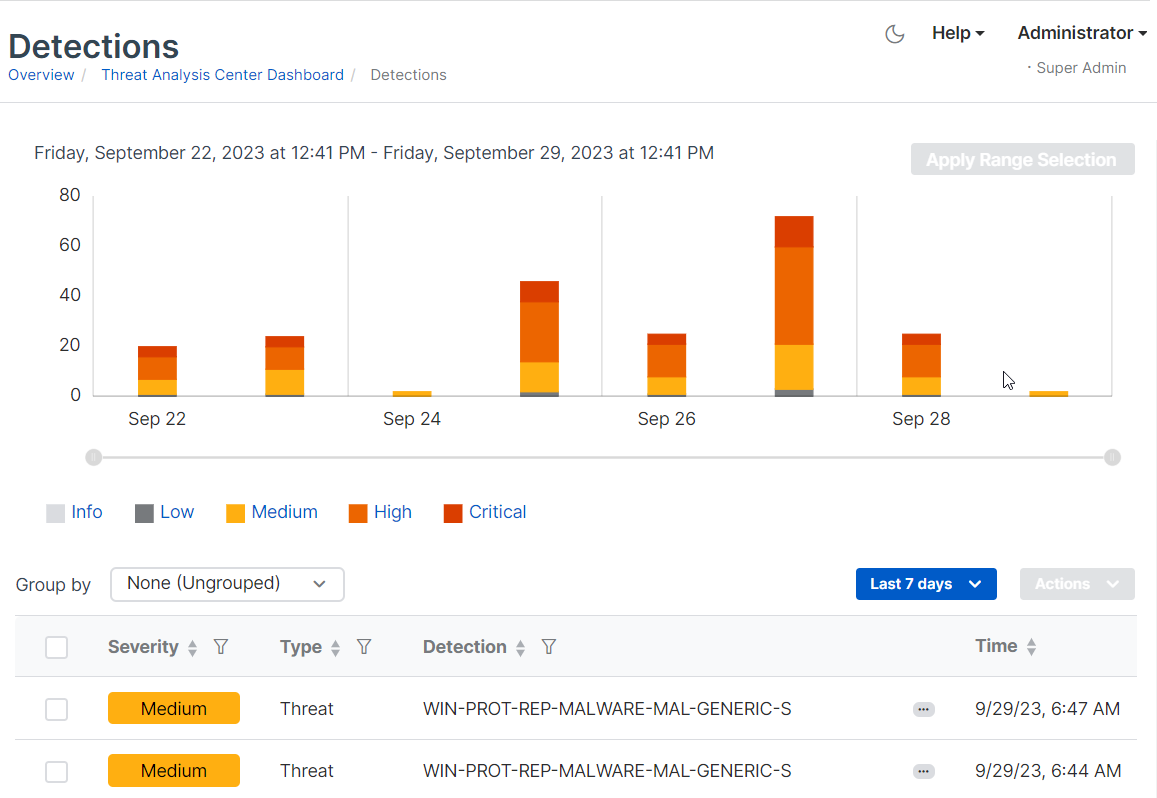
See a summary
The bar chart shows a summary of recent detections on a timeline. By default, we show detections from the previous 24 hours.
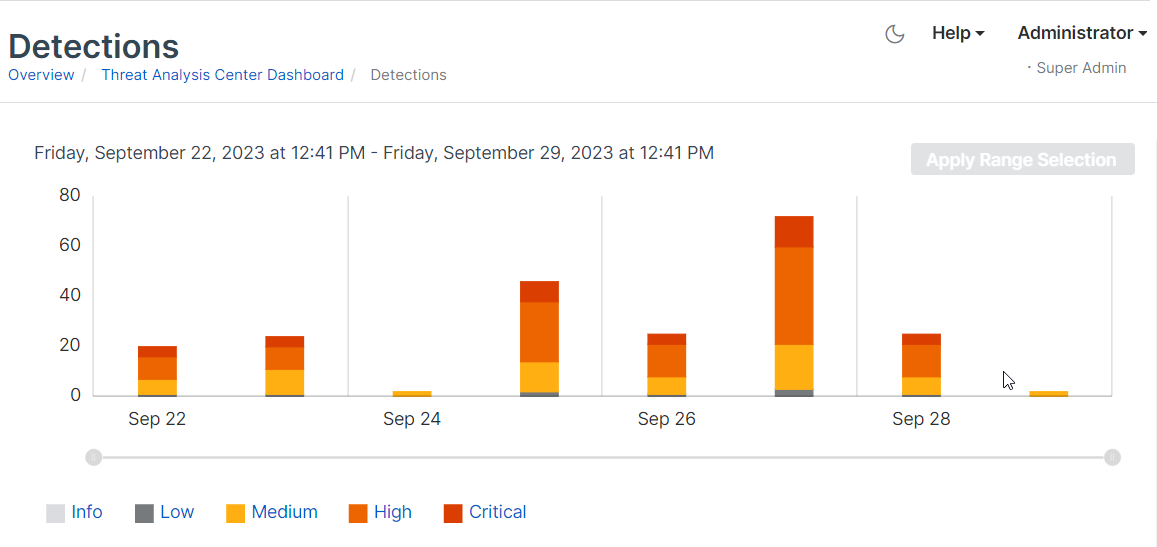
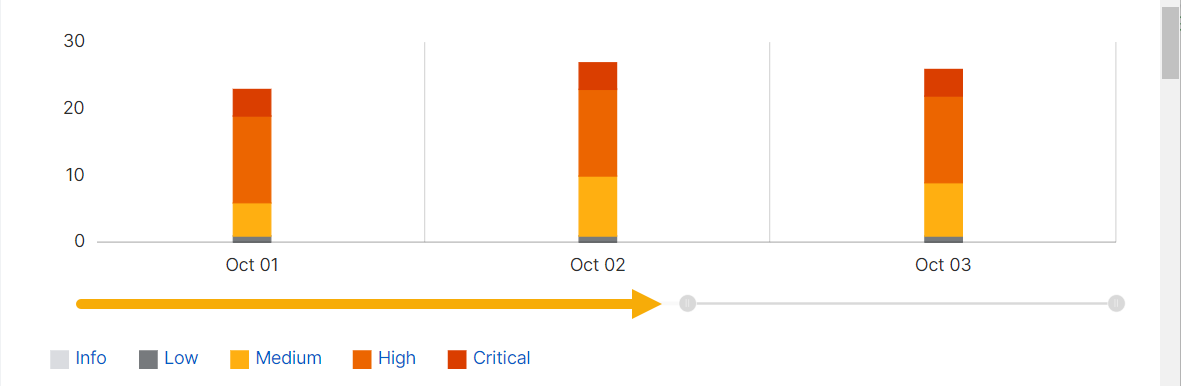
Use the time range slider
You can use the slider to zoom in on a shorter time range or zoom out. Just click the handle at one end of the slider and drag it.
You can also set a different time range or a custom range by using the menu above the detections list.
Hover to see statistics
You can also get a breakdown of detection numbers. Go to a bar in the chart, put the cursor over one band (for example, high severity), and hover to see the number of detections with that severity.
Note
You can also click a band in the bar chart to show only detections of that severity in the detections list.
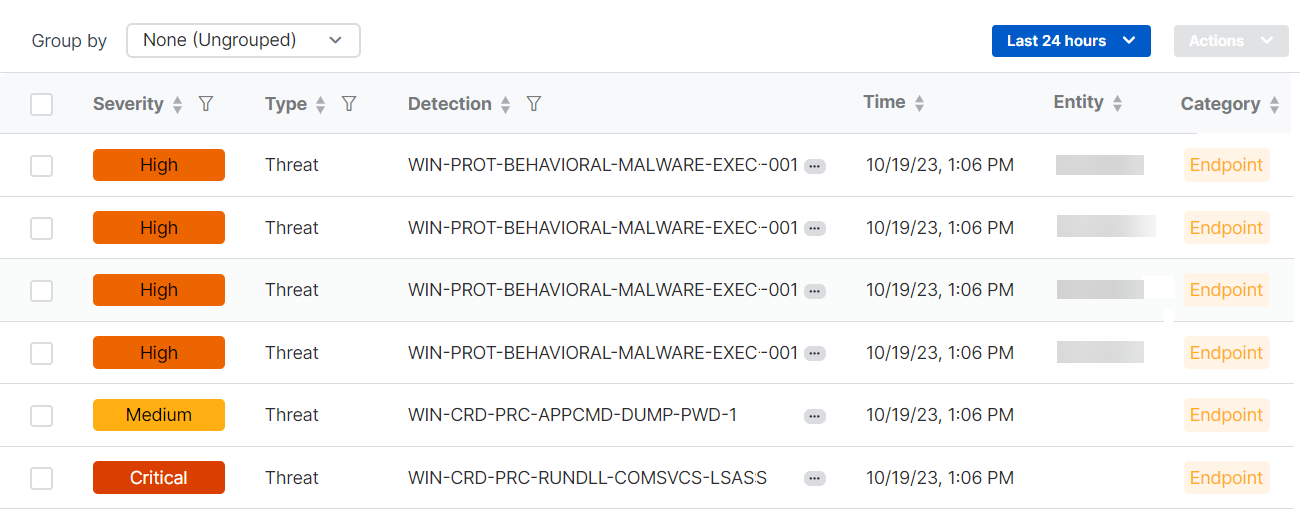
See the list of detections
The detections list shows all detections together with the following details:
- Severity. The level of risk that the detection represents.
- Type. The detection type. Currently, the types shown are "Threat" or "Vulnerability”.
- Detection. Detection name.
- Time. Time of detection.
- Entity. The device. Later, we'll also use this column to show IP address or user.
- Category. The source type. Endpoint, Network, Firewall, Email, Cloud, or ID provider.
- Source. The source of the detection. The source can be Sophos or third-party software.
- MITRE ATT&CK. The corresponding MITRE ATT&CK tactic and technique.
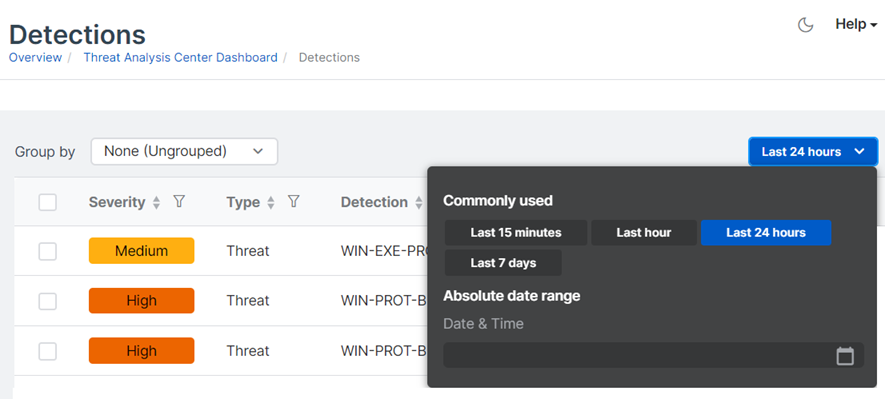
Change the time range
You can change the time range of detections shown by the detections list and the bar chart.
In the drop-down menu above the list, select one of the Commonly used time ranges, or click Absolute date range and set a custom range.
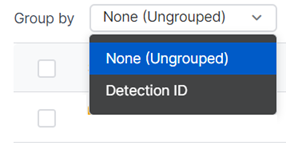
Group detections
You can group detections according to the rule they matched.
-
In the Group by drop-down menu, select Detection ID.
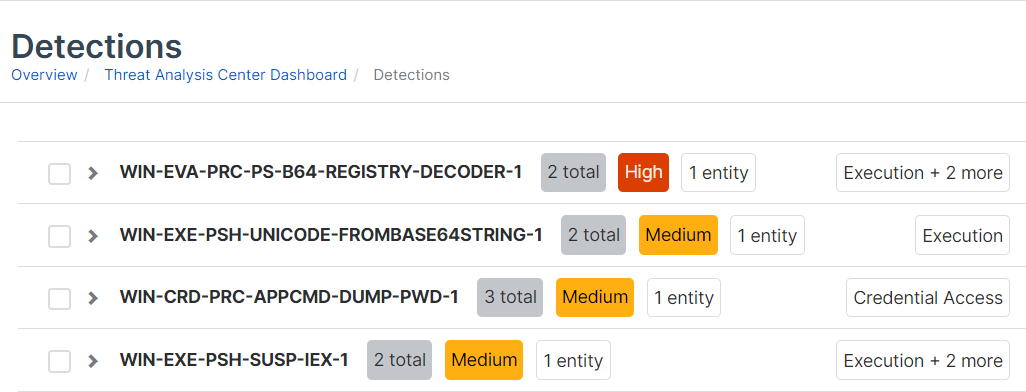
-
Detections of the same events are grouped and shown in a single row in the list
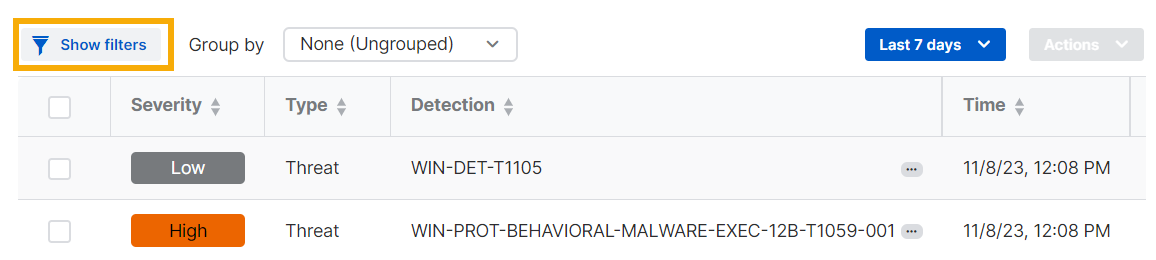
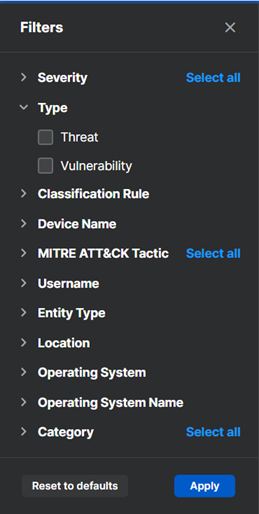
Filter detections
You can filter detections by their severity, the type of threat, the MITRE ATT&CK tactic used, and other characteristics.
-
On the Detections list, click Show filters.
-
Click a filter category to show the characteristics you can use as filters. For example, click Type and select Threat or Vulnerability.
-
Click more categories and select the filters you want.
- Click Apply.
For some categories, such as username or device name, you enter your own terms to use for filtering.
For categories with many characteristics you can select, like MITRE ATT&CK Tactic, you can click Select all.
To clear all filters, click Reset to defaults.
You can apply filters to grouped detections as well as ungrouped ones.
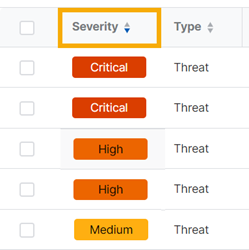
Sort detections
You can sort the detections list.
Click the sort arrows next to a column header to sort the list by ascending or descending alphabetical, numerical, or date order, or by priority for the Severity column.
You can apply sorting to grouped detections as well as ungrouped ones.
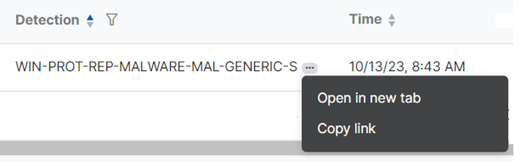
Open and share detections
-
Click the three dots next to the detection name in the table
 .
. -
Click Open in new tab to open detection details or Copy link if you want to share the details with colleagues.
See detection details
For full details of a detection, such as the device, users, and processes involved, click anywhere in its row in the table.
A new pane slides out on the right of the screen.
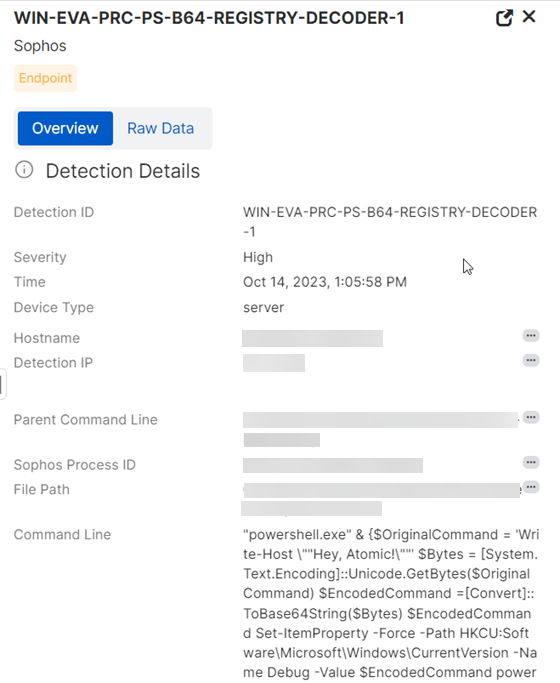
This details pane lets you quickly review detections, open multiple detections in new tabs, use pivot queries, get MITRE ATT&CK details, and find similar detections.
If you want to see the full data that the details are based on, click the Raw Data tab.
Quickly review detections
You don't have to switch between views to review the details of multiple detections.
Click a detection in the main table to open the slide-out. Then, click another detection in the table. The slide-out details automatically change to show the details of that detection.
Open multiple detections
You can open multiple detections in new tabs so that you can keep them open and compare them easily.
In the detection details slide-out, click the expand button to open the detection details in a new tab.
![]()
Use pivot queries, enrichments, and actions
You can find out more about detections by using pivot queries.
A pivot query lets you select a significant piece of data in a detection and use it as the basis for further investigation.
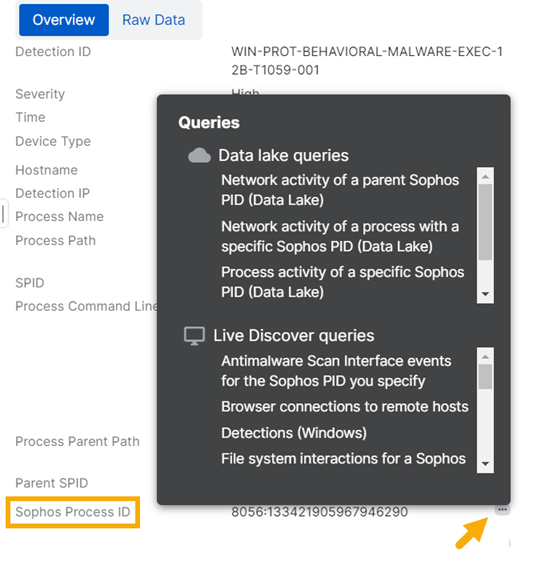
In the detection details slide-out, you'll see three dots next to some items. ![]()
Click the icon to see actions you can take. These depend on the type of data.
- Queries. You can run a query based on the data selected. Live Discover queries look at data on your devices (when they're online). Data Lake queries look at the data that devices upload to the Sophos Data Lake.
- Enrichments. These open various sources of threat intelligence (like VirusTotal) to help you investigate a potential threat. They can also open SophosLabs Intelix reports if they're available. See Intelix reports.
- Actions. These offer further detection or remediation. For example, you can scan a device or start Sophos Live Response to access and investigate a device.
In the example shown, clicking the icon beside the Sophos Process ID lets you run queries based on that ID.
Get MITRE ATT&CK details
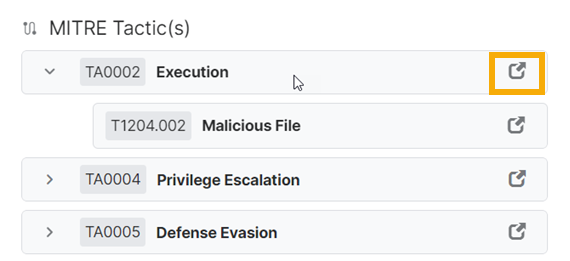
For many detections, the detection details pane shows the MITRE ATT&CK tactic.
Click the fold-out arrow beside the tactic to see the technique.
Click the link beside any tactic or technique, for example TA0002 Execution in the screenshot below, to go to its details on the MITRE website.
Find similar detections
In the detection details slide-out, click Similar detections. The similar detections then show in the main table.
Add detections to a case
Cases group together suspicious events reported in Detections and help you do forensic work on them. See Cases.
On the Detections page, you can add a detection to an existing case or create a new case.
Add to a case
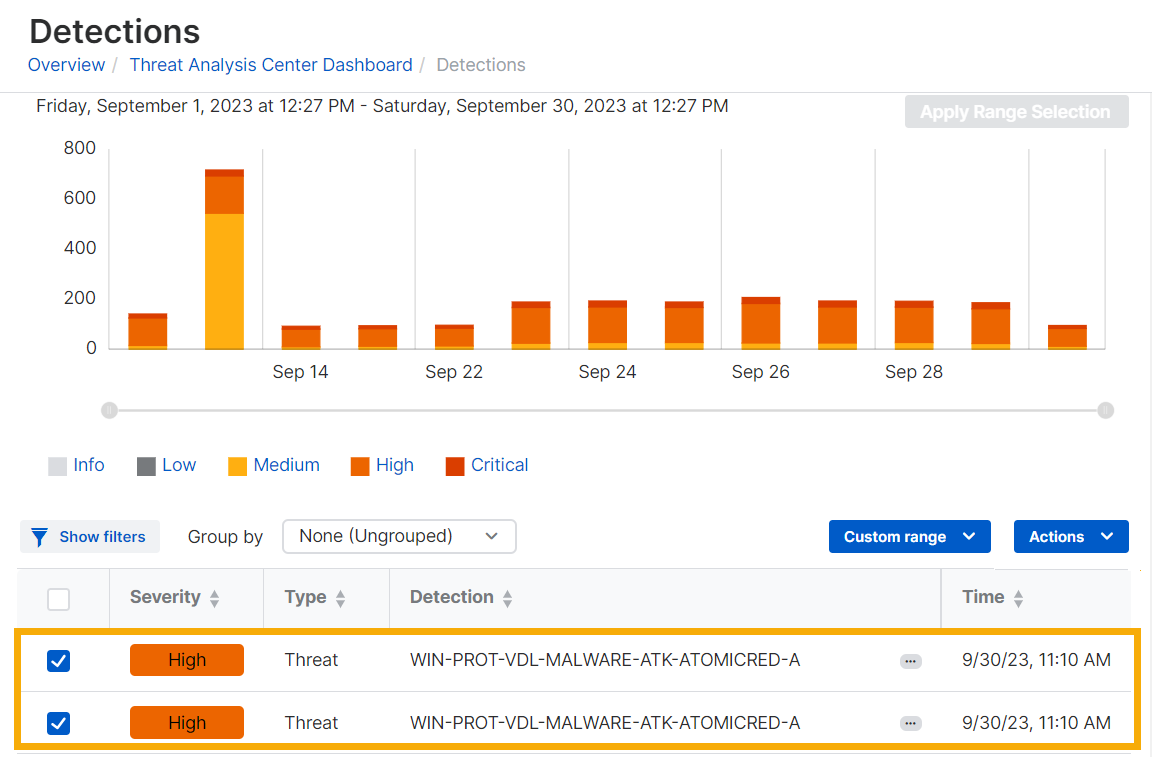
-
In the Detections list, select the detections you want to add.
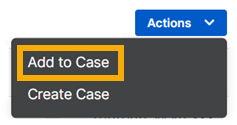
-
Click Actions > Add to Case.
-
Click a case and click Add to Case.
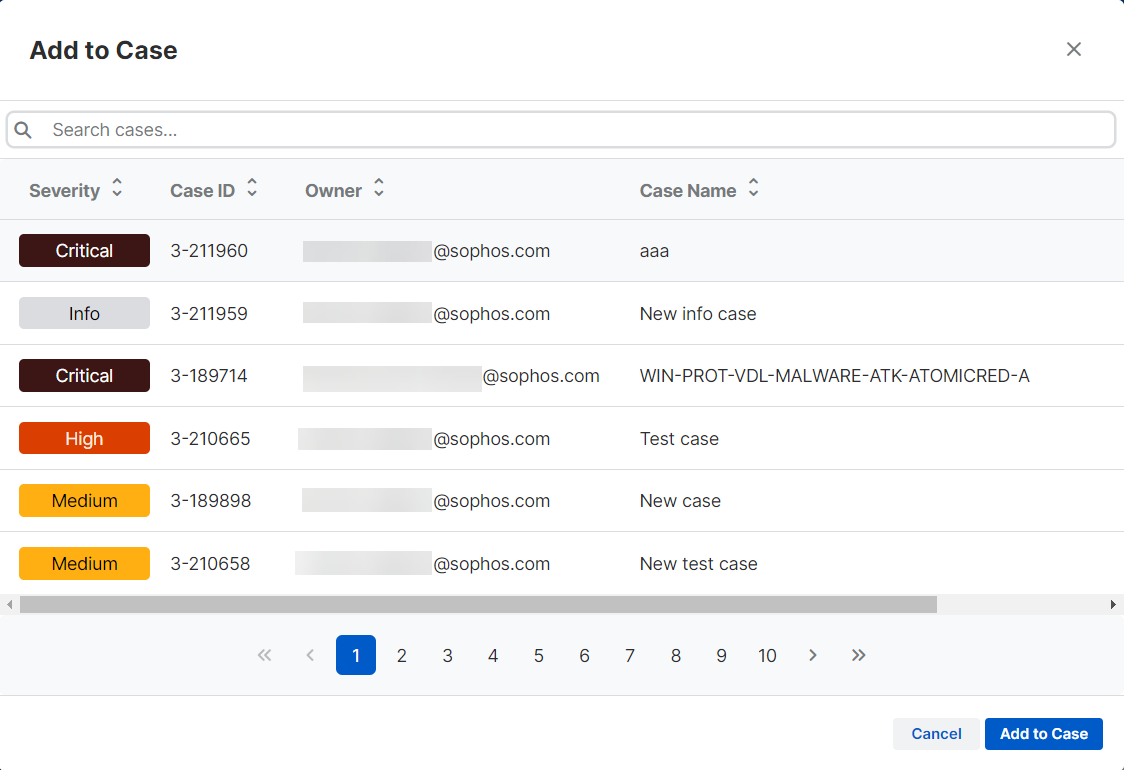
The case name shows in the Cases column for that detection and at the bottom of its details pane.
The detection is included in the case's details on the Cases page.
Create a case
To create a new case and add detections to it, do as follows:
-
In the Detections list, select the detections you want to investigate.
-
Click Actions > Create Case.

-
In Create case, do as follows:
- Enter a case name and description.
- Select the Severity.
- Select the Status (New or Investigating).
- Select an Assignee. This is the admin who will investigate the case.
- Click Create.
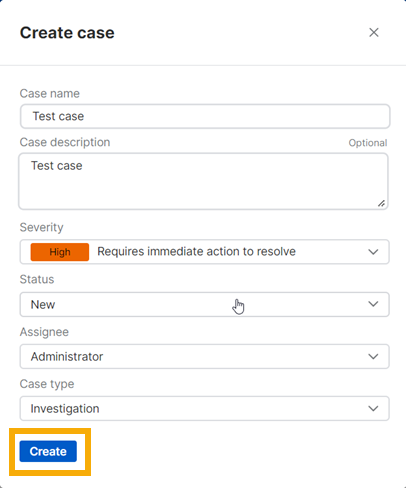
A case is added to the Cases page.
The case name also shows in the Cases column for that detection and at the bottom of its details pane.
Look for potential threats
You can use detections to examine devices, processes, users, and events for signs of potential threats that other Sophos features haven't blocked. For example:
- Unusual commands that indicate attempts to inspect your systems and stay on them, avoid security, or steal credentials.
- Sophos malware alerts, such as dynamic shellcode prevention events, that indicate an attacker might have penetrated a device.
- Linux runtime detections, such as container escapes, that indicate an attacker is escalating privileges from container access to move across to the container host.
Most detections are linked to the MITRE ATT&CK framework, where you can find more information on the specific tactic and technique. See https://attack.mitre.org/.
You can also search for signs of a suspected or known threat that Sophos has found elsewhere or for out-of-date software or insecure browsers.
Get help
Sophos Support can't help you to investigate detections.
If you purchase the Managed Detection and Response (MDR) service, our analysts monitor your environment for malicious activity and contact you or respond on your behalf 24/7. See Managed Detection and Response.
Note
If you believe your security has been breached and you need immediate help, contact our rapid-response team. This is a paid service. See Sophos Rapid Response.